

What is a candlestick?
A candlestick is a way of displaying information about an asset’s price movement. Candlestick charts are one of the most popular components of technical analysis, enabling traders to interpret price information quickly and from just a few price bars.
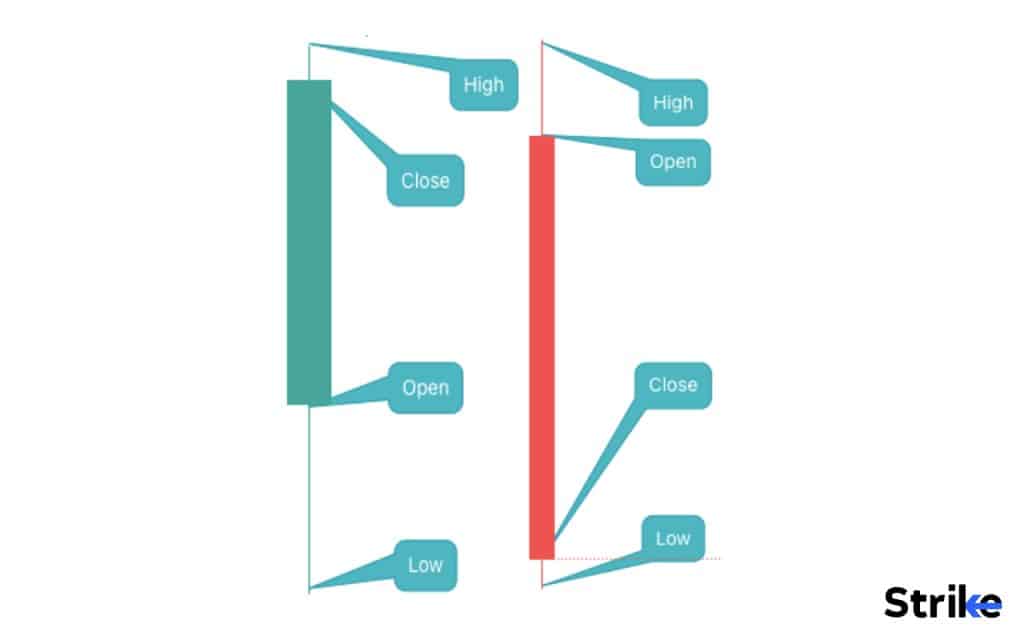
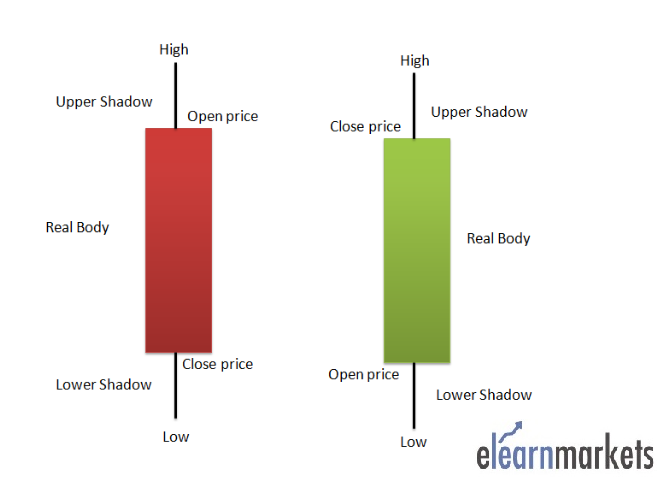
This article focuses on a daily chart, wherein each candlestick details a single day’s trading. It has three basic features:
- The body, which represents the open-to-close range
- The wick, or shadow, that indicates the intra-day high and low
- The colour, which reveals the direction of market movement – a green (or white) body indicates a price increase, while a red (or black) body shows a price decrease
Over time, individual candlesticks form patterns that traders can use to recognise major support and resistance levels. There are a great many candlestick patterns that indicate an opportunity within a market – some provide insight into the balance between buying and selling pressures, while others identify continuation patterns or market indecision.
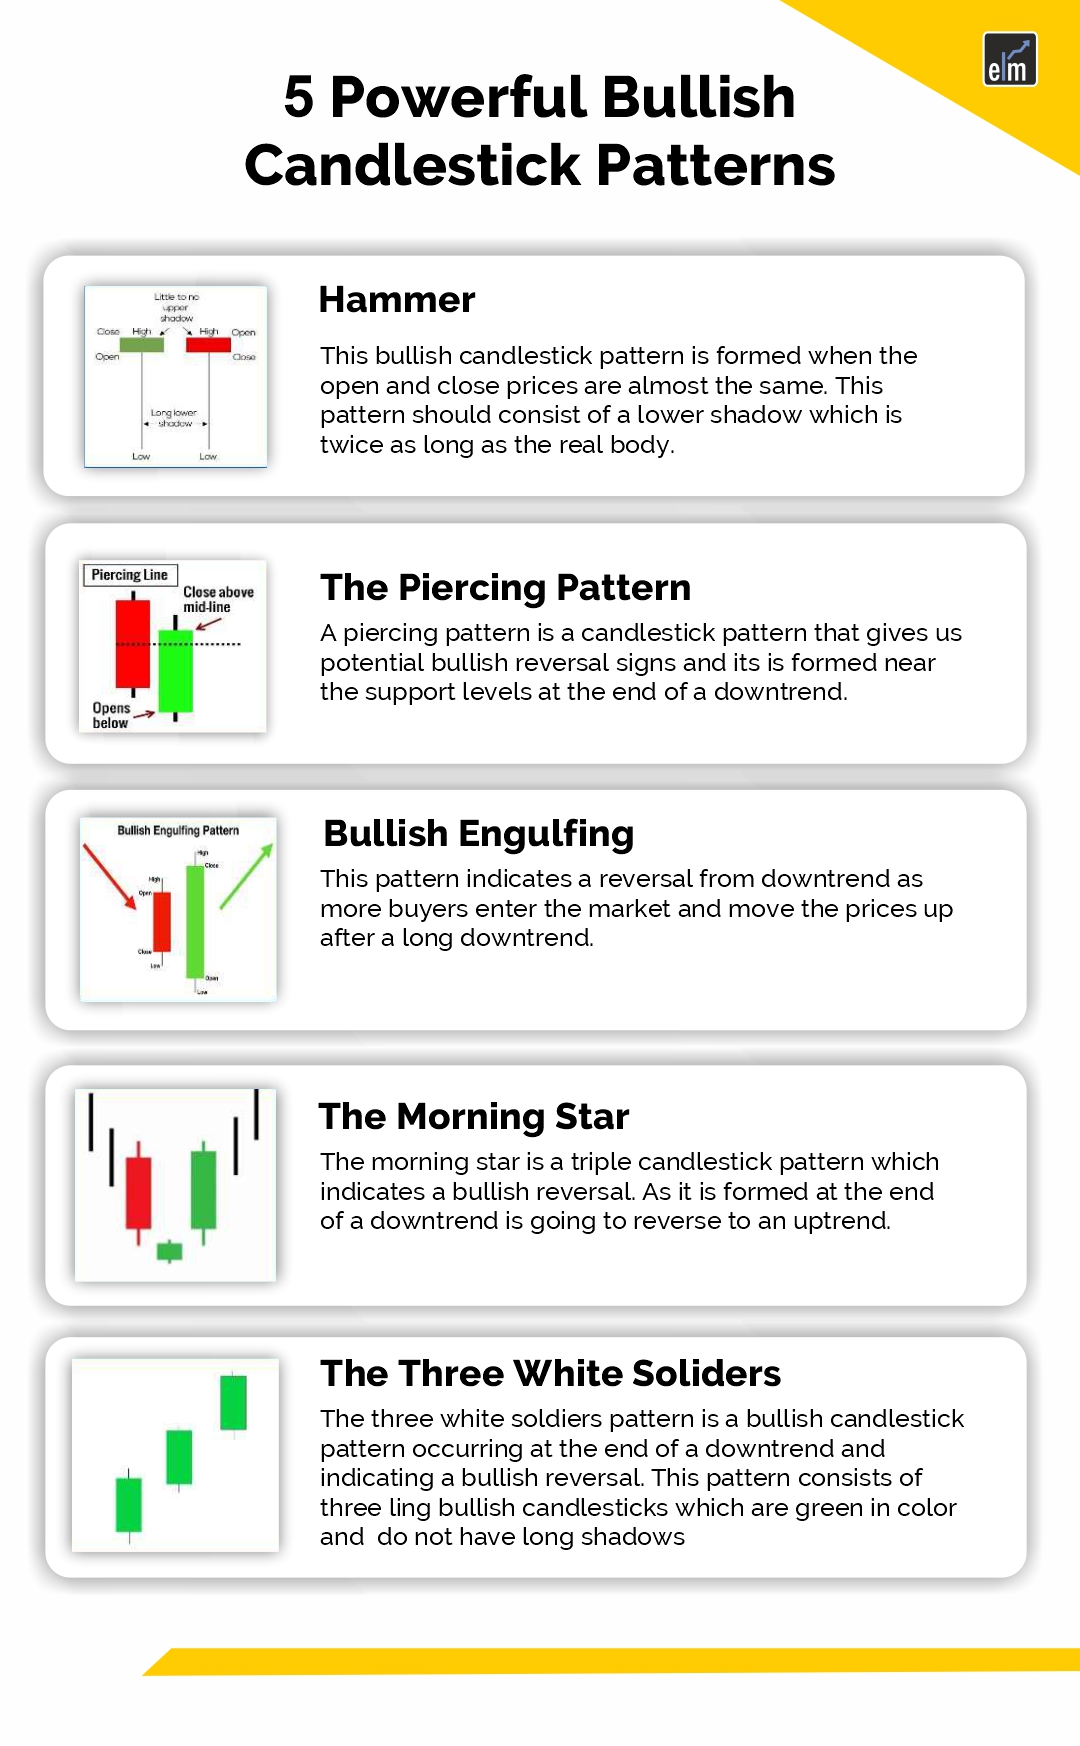
5 Bullish Candlestick Patterns
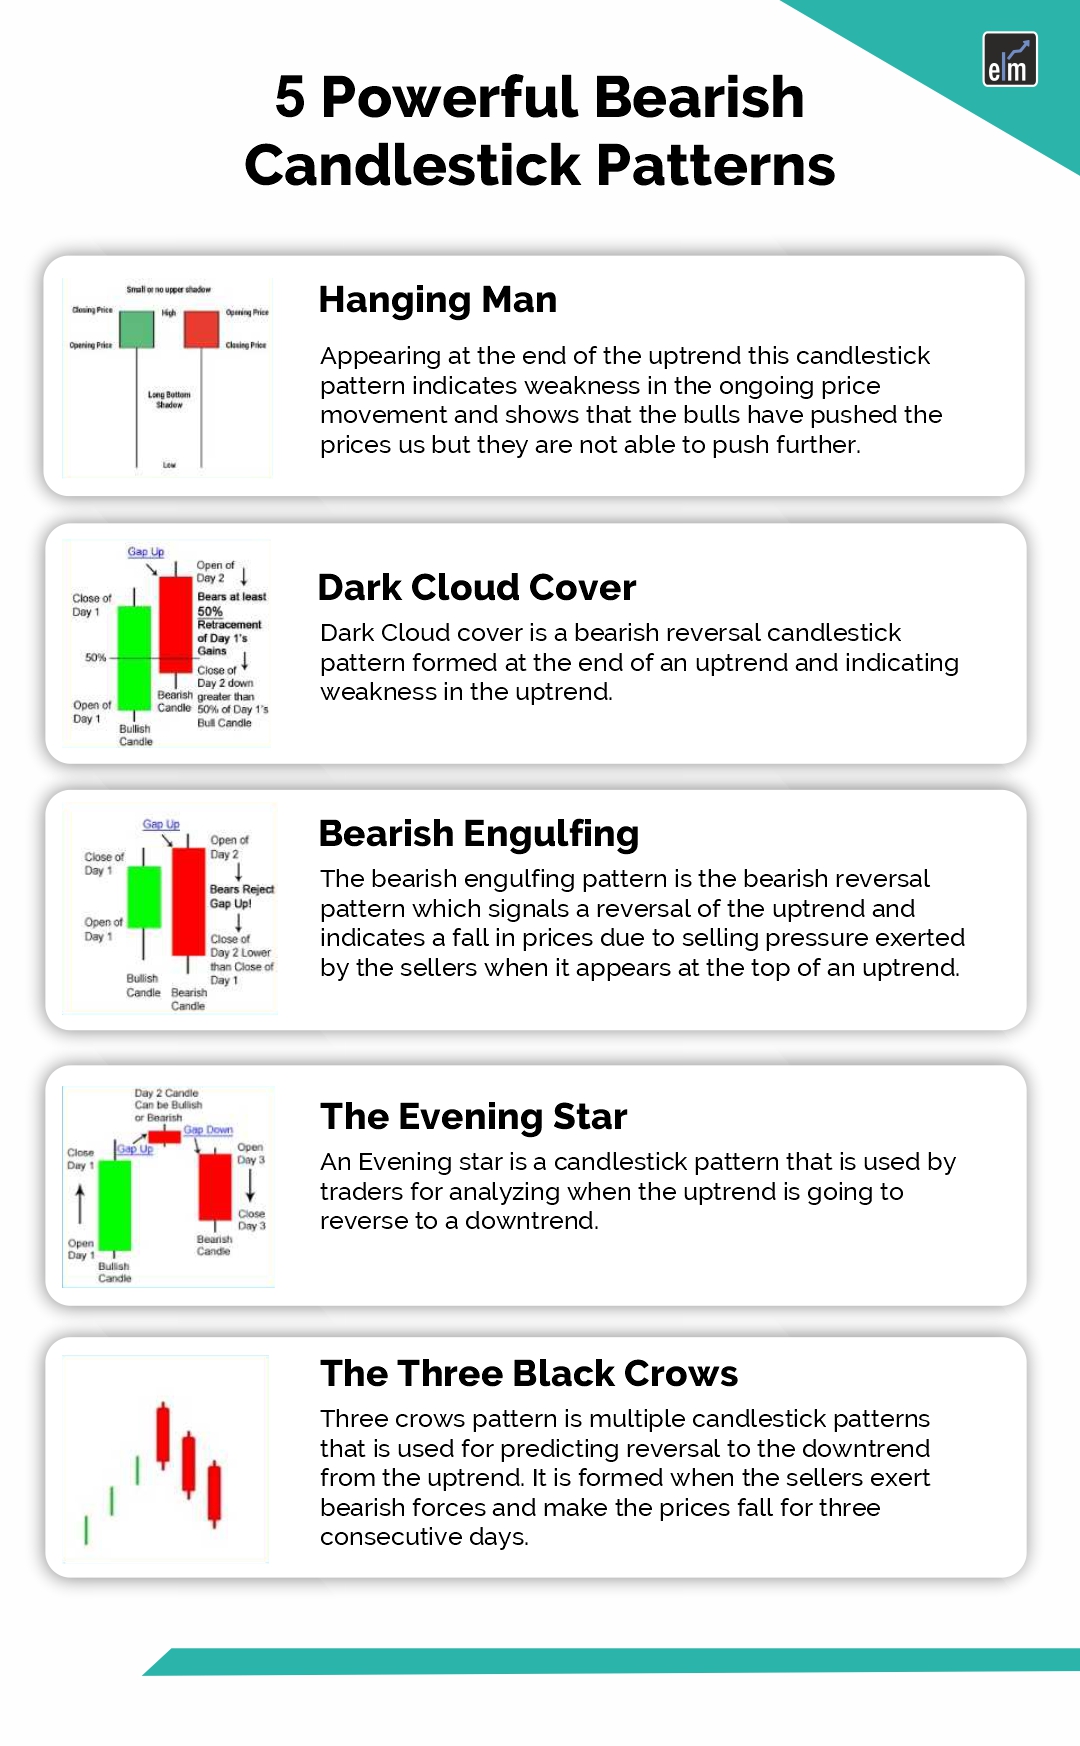
5 Powerful Bearish Candlestick Patterns
The Marubozu
The Marubozu is the first single candlestick pattern that we will understand. The word Marubozu means “Bald” in Japanese. We will understand the context of the terminology soon. There are two types of marubozu – the bullish marubozu and the bearish marubozu.
Before we proceed, let us lay down the three important rules about candlesticks. We looked at it in the previous chapter; I’ve reproduced the same for quick reference:
- Buy strength and sell weakness.
- Be flexible with patterns (verify and quantify)
- Look for the prior trend.
Marubozu is probably the only candlestick pattern that violates rule number 3, i.e., looking for a prior trend. A Marubozu can appear anywhere in the chart irrespective of the prior trend; the trading implication remains the same.
The textbook defines Marubozu as a candlestick with no upper and lower shadow (therefore appearing bald). A Marubozu has just the real body, as shown below. However, there are exceptions to this. We will look into these exceptions shortly.

The red candle represents the bearish marubozu, and the blue represents the bullish marubozu.
Bullish Marubozu
The absence of the upper and lower shadow in a bullish marubozu implies that the low is equal to the open and the high is equal to the close. Hence whenever the Open = Low and High = close, a bullish marubozu is formed.
A bullish marubozu indicates that there is so much buying interest in the stock that the market participants were willing to buy the stock at every price point during the day, so much so that the stock closed near its high point for the day. It does not matter what the prior trend has been, the action on the marubozu day suggests that the sentiment has changed and the stock is now bullish.
The expectation is that with this sudden change in sentiment, there is a surge of bullishness, and this bullish sentiment will continue over the next few trading sessions. Hence a trader should look at buying opportunities with the occurrence of a bullish marubozu. The buying price should be around the closing price of the marubozu.
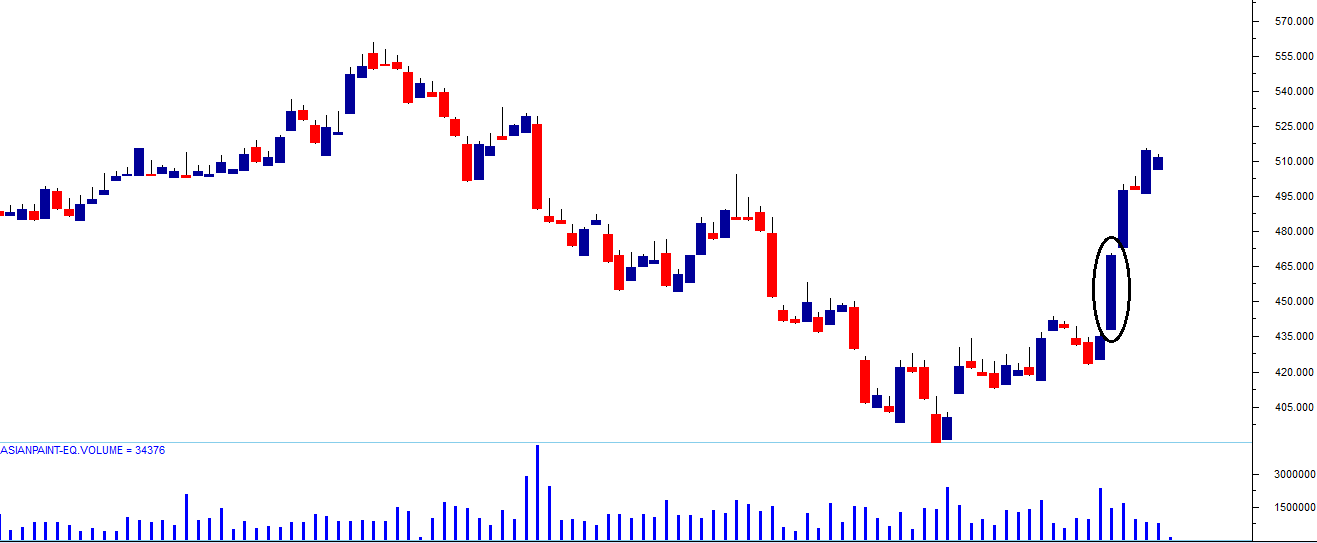
Here is another example (Asian Paints Ltd) where both the risk-taker, and the risk-averse trader would have been profitable.
Here is an example where the risk-averse trader would have benefited :
The Stoploss on Bullish Marubozu
What if after buying, the market reverses its direction and the trade goes wrong? Like I had mentioned earlier, candlestick patterns come with an inbuilt risk management mechanism. In case of a bullish marubozu, the low of the stock acts as a stoploss. So after you initiate a buy trade, if the markets move in the opposite direction, you should exit the stock if price breaches the low of the marubozu.
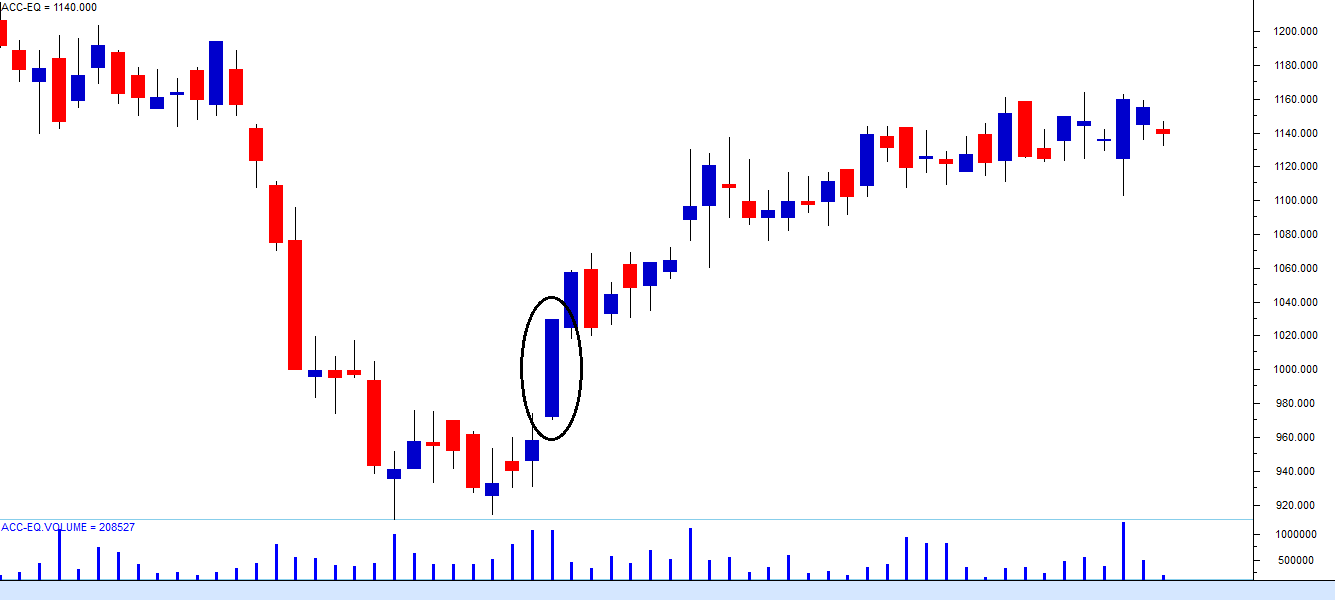
Here is an example where the bullish marubozu qualified as a buy for both the risk-averse and the risk-taker. The OHLC is : O = 960.2, H = 988.6, L = 959.85, C = 988.5.
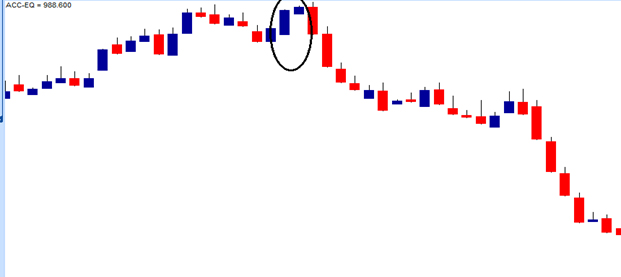
But the pattern eventually failed, and one would have booked a loss. The stoploss for this trade would be the low of marubozu, i.e. 959.85.
Bearish Marubozu
Bearish Marubozu indicates extreme bearishness. Here the open is equal to the high and close the is equal to low. Open = High, and Close = Low.
A bearish marubozu indicates that there is so much selling pressure in the stock that the market participants actually sold at every price point during the day, so much so that the stock closed near its low point of the day. It does not matter what the prior trend has been, the action on the marubozu day suggests that the sentiment has changed and the stock is now bearish.
The expectation is that this sudden change in sentiment will be carried forward over the next few trading sessions, and hence one should look at shorting opportunities. The selling price should be around the closing price of the marubozu.
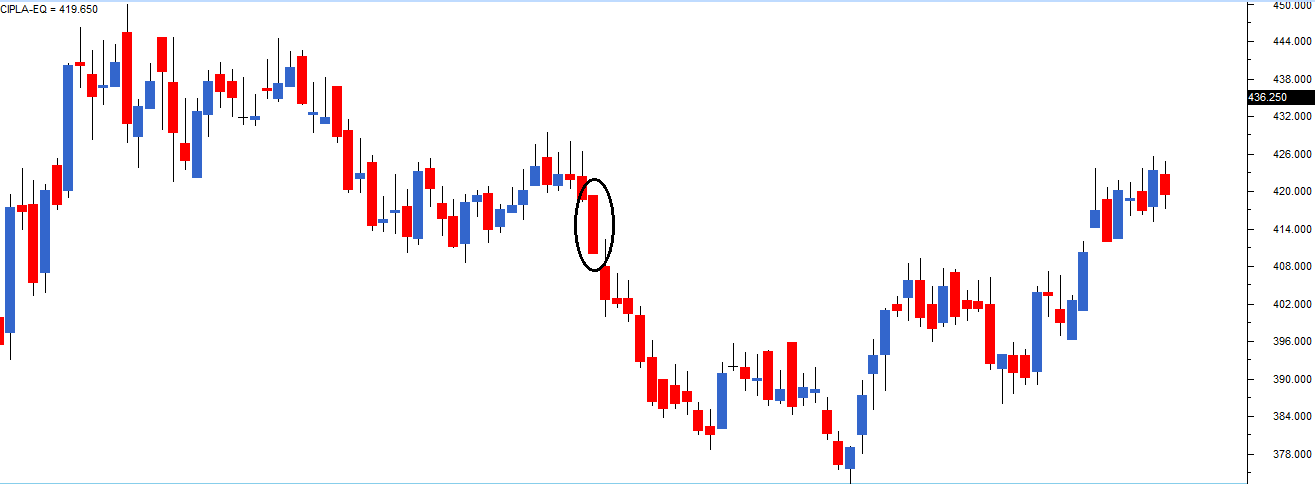
In the chart above (BPCL Limited), the encircled candle indicates the presence of a bearish marubozu. Notice the candle does not have an upper and a lower shadow.
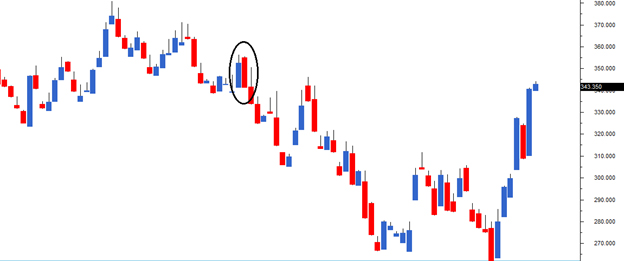
Here is another chart, Cipla Limited, where the bearish marubozu has been profitable for both risk-taker, and a risk-averse trader. Remember these are short term trades and one needs to be quick in booking profits.
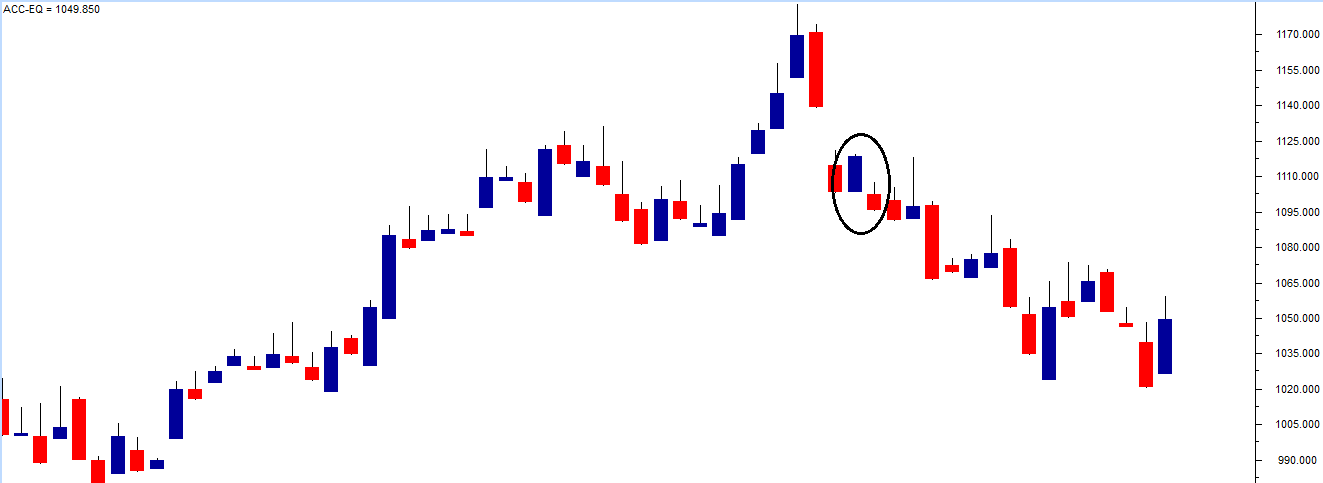
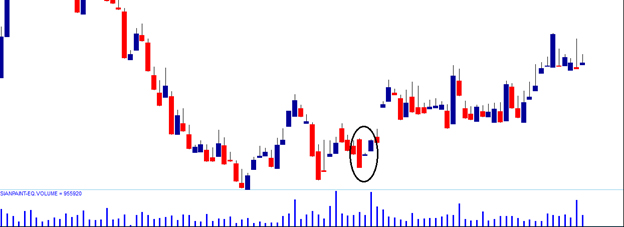
Here is a chart showing a bearish marubozu pattern that would not have worked out for the risk-taker, but a risk-averse trader would have avoided initiating the trade, thanks to rule 1.
The trade trap
Earlier in this chapter, we did discuss the length of the candle. One should avoid trading during a minimal (below 1% range) or long candle (above 10% range).
A small candle indicates subdued trading activity, and hence it would be difficult to identify the direction of the trade. On the other hand, a long candle indicates extreme activity. The problem with lengthy candles would be the placement of stoploss. The stoploss would be deep, and in case the trade goes wrong, the penalty for paying would be painful. For this reason, one should avoid trading on candles that are either too short or too long.
Key takeaways from this chapter
- Remember the rules based on which candlesticks work.
- Marubozu is the only pattern which violates rule number 3, i.e. Look for the prior trend.
- A bullish marubozu indicates bullishness.
- Buy around the closing price of a bullish marubozu
- Keep the low of the marubozu as the stoploss
- A bearish marubozu indicates bearishness.
- Sell around the closing price of a bearish marubozu
- Keep the high of the marubozu as the stoploss
- An aggressive trader can place the trade on the same day as the pattern forms.
- Risk-averse traders can place the trade on the next day after ensuring that it obeys rule number 1, i.e. Buy strength, and Sell weakness.
- Abnormal candle lengths should not be traded.
- Short candle indicates subdued activity.
- Long candle indicates extreme activity; however, placing stoploss becomes an issue.